
A Nasdaq number can look like a clear signal: up means confidence, down means trouble. But a market quote is only useful when you know which index it represents, when it was updated, and what it leaves out. That context matters whether you’re checking a chart before work or trying to understand why a tech-heavy portfolio moved overnight.
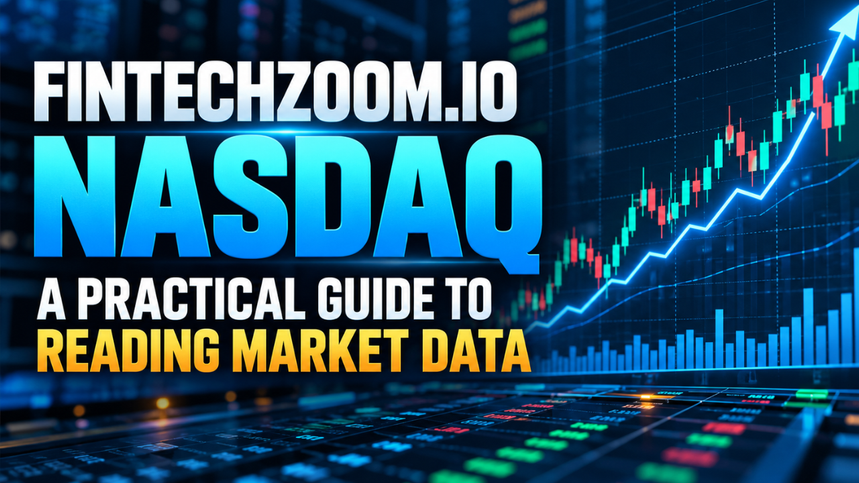
People searching for “FintechZoom.io Nasdaq” are usually looking for market coverage, charts, or a quick explanation of the index. FintechZoom.io does publish Nasdaq-related material, but it’s a financial media and research site, not the exchange itself. Knowing that distinction makes it easier to use the page as a starting point and verify anything that could affect a decision.
Table of Contents
- What “FintechZoom.io Nasdaq” means
- Know which Nasdaq you’re looking at
- How to read a Nasdaq quote and chart
- Check timestamps, sources, and market hours
- What an index can tell you
- Using FintechZoom.io carefully
- A simple routine for checking Nasdaq data
- The takeaway
What “FintechZoom.io Nasdaq” means
The phrase joins two different things: FintechZoom.io, a finance and technology website, and Nasdaq, the U.S. exchange brand and family of market indexes. On its homepage, FintechZoom describes itself as a media platform covering financial technology, stocks, and global indexes. Its Nasdaq guide discusses index tracking and market charts.
That distinction matters. A Nasdaq-related article isn’t necessarily operated by Nasdaq, and a market chart doesn’t mean readers can trade there. Use FintechZoom.io for coverage and commentary; use Nasdaq’s official site for index definitions, exchange notices, and schedules.
Its Nasdaq guide also includes projected index levels for 2023 through 2032. Those are forecasts on the page, not official Nasdaq targets; several listed years have passed, so check dates and methodology before relying on them. Precise numbers don’t make a forecast reliable.
Know which Nasdaq you’re looking at
“Nasdaq” can mean the stock market where companies list shares, or an index designed to measure a group of those shares. Many people use the word loosely, including when they mean one of two familiar indexes: the Nasdaq Composite or the Nasdaq-100. They overlap, but they aren’t interchangeable.
The Nasdaq Composite broadly includes domestic and international common stocks listed on Nasdaq; the Nasdaq-100 tracks the 100 largest non-financial companies listed there. It concentrates more heavily in large companies and excludes financial firms. Nasdaq’s market activity page summarizes the difference, while its index comparison explains why they can move apart.
Here’s a practical example. Suppose a headline says “the Nasdaq fell,” while your portfolio holds an exchange-traded fund that tracks the Nasdaq-100. If the displayed figure refers to the Composite, it may not match your fund’s movement exactly. Different membership rules and weightings can produce different results, especially when financial shares or smaller listed companies behave differently from the biggest technology names.
Before interpreting a chart, look for the full index name or ticker. If the page only says “Nasdaq,” find out what it means. A small label can change the story.
How to read a Nasdaq quote and chart
Start with the quote itself. Check the index name, current level, point change, and percentage change. The level is a number of index points, not a dollar price you can pay to buy the index. The percentage change helps put the day’s move in proportion: a 100-point move means something different when the index is at 10,000 than when it is at 20,000.
Next, check the comparison period. “Up 1%” might mean up today, over the past five sessions, or since the start of the year. A chart should make its selected time range visible. If it doesn’t, change the range or treat the pattern cautiously. A dramatic one-day dip can disappear in a six-month view; a long upward line can conceal a sharp recent drop.
Volume and context matter too. An index level alone doesn’t tell you whether most of its constituent stocks rose, whether a few giant companies drove the move, or whether the figure is changing outside regular hours. Headlines can help explain a move, but they’re not proof of cause. A chart that rises after a company reports earnings doesn’t automatically mean that company caused the entire index gain.
If you’re looking at a stock rather than an index, confirm the company symbol and exchange. Similar names and ticker symbols can lead to errors, and one company’s share price is not the same thing as the index it belongs to.
Check timestamps, sources, and market hours
A quote without a timestamp is incomplete information. Look for the date, time zone, and any label such as “real time,” “delayed,” or “previous close.” FintechZoom.io describes real-time chart updates on its site, but the Nasdaq guide itself does not make every quote’s timing or data feed obvious. When timing matters, compare the figure with Nasdaq’s market activity pages, which state that public Nasdaq index data is delayed by at least one minute.
Market hours can explain why two pages show different numbers. As of September 23, 2026, the regular Nasdaq Stock Market session runs from 9:30 a.m. to 4:00 p.m. Eastern Time. Nasdaq also lists pre-market trading from 4:00 to 9:30 a.m. After-hours trading runs from 4:00 p.m. to 8:00 p.m. ET. Extended sessions tend to have lower liquidity and greater volatility, and access varies by broker.
There’s also a scheduled change ahead: Nasdaq announced a new 9:00 p.m.–4:00 a.m. ET session beginning December 6, 2026, which will create a 23-hour trading day on weekdays. That makes checking a current schedule especially useful; market hours, holidays, and broker availability can change. Nasdaq’s holiday and trading-hours page and trader notice are better sources for the latest timetable than an undated article.
What an index can tell you
An index is a useful temperature check, not a diagnosis. A rising Nasdaq Composite may suggest that the overall group of listed shares is gaining value, while a rising Nasdaq-100 may reflect strength among large non-financial companies. Neither number tells you by itself whether a particular company is healthy, fairly valued, or right for your goals.
Indexes are weighted, so the largest companies influence their movement more than smaller members. A handful of major stocks can lift an index while many others fall, much like a class average that rises even when several students struggle.
For a fuller picture, pair the index with market breadth, sector performance, and economic news. If a fund tracks the Nasdaq-100, check its price and holdings rather than assuming a general “Nasdaq” chart mirrors your account. Your return also reflects when you bought, fees, and possibly currency conversion—details an index number leaves out.
Using FintechZoom.io carefully
A finance site can be handy for a quick overview or an accessible explanation. FintechZoom.io’s Nasdaq page may help readers new to the terminology, and its wider site covers other areas of finance and technology. Check whether the information is current, clearly labeled, and supported well enough for your purpose.
Treat forecasts as opinions, not promises. Check the publication date, author, and method behind a prediction. If a page gives a precise future index level without explaining its assumptions, don’t confuse precision with reliability. Earnings, interest rates, economic data, regulation, and unexpected events can all change market conditions.
For a financial decision, verify the symbol, timestamp, and price with a broker or primary source, then review relevant company filings or fund documents. Confident wording is no substitute for that homework.
A simple routine for checking Nasdaq data
When you open a market page, take a few seconds to follow the same steps. First, identify whether you’re viewing the Composite, Nasdaq-100, or an individual stock. Then check the timestamp and time zone. Confirm the chart range and whether it includes pre-market or after-hours movement. Finally, compare the number with an official Nasdaq quote or the brokerage account that holds the investment you’re tracking.
Imagine checking your phone during lunch and seeing a sharp drop. Before reacting, confirm whether the figure is current or yesterday’s close, and whether it’s the index your fund follows. Then scan a reliable market update for context. That little pause can prevent you from treating a stale number or mismatched index as a fresh warning about your own holdings.
You don’t need to turn every check into a research project. Just confirm what you’re seeing before drawing a conclusion; a minute of verification can prevent a lot of confusion.
The takeaway
FintechZoom.io Nasdaq is best understood as a search for Nasdaq-related coverage on a separate finance media website. Its pages can introduce the topic, but readers should distinguish the Nasdaq exchange from the Composite and Nasdaq-100 indexes, and verify quote timing, index identity, and forecast dates before acting on what they see. Use the page for context, use official Nasdaq and broker sources to confirm current market details, and remember that an index is one useful signal—not the whole investment picture.